Flu Spikes and Google Search Terms
Now that I'm in my second-to-last MPH semester, I've been thinking about potential masters thesis topics. In an ideal world, I would use my coursework products from my classes this semester (advanced biostats and research methods) to get a head start on my capstone. I am considering doing another disease incidence modeling project, similar to my Lyme Disease & Climate Change project. I'm specifically interested in creating a model to forecast and nowcast respiratory disease incidence in Kent County by parameterizing weather, climate, and other community data
As a particular example, I want to explore the relationship between Google search queries and respiratory disease. I hypothesize that search terms related to cold&flu symptoms should spike 1-2 weeks before ILI incidence spikes.
To explore my hypothesis, I will do some exploratory data analysis and visualization
This mini-project uses Pytrends to exploit Google Trends search term data from within the Grand Rapids metro area. I will leverage this data alongside Kent County ILI incidence data from my practicum to examine the relations between specific Google search terms and ILI incidence
To call the Google Trends API, we must give Google information about which search term history we want, from which time period, and from where. Specifying location and timeframe is vital for the reliability of the data because Google normalizes and scales the data based on population size. Our specified search terms, location, and time period will be the 'payload' of our data request. Google expects to see the 2-character alpha geocode for both country and state; US-MI. To drill down to the city level we use DMA codes. The DMA code for Grand Rapids-Kalamazoo-Battle Creek is 563, so altogether, the location code is
geo = US-MI-563
There are a few ways to specify the timeframe of interest. The default is the last 5 years, 'today 5-y', following the Current Time Minus Time Pattern. To specify by month, 'today #-m', by day, 'today #-d', and by hour, 'today #-h' Another option is to specify a date range in the format 'yyyy-mm-dd yyy-mm-dd.' To see ten years of data, we will specify
timeframe = '2012-01-01 2023-07-01'
Optionally, we may specify a search term category to narrow our results. The default category cat = 0, and the rest of the category codes can be found here. The category code for 'Health Conditions' is
cat = 419
Now we're ready to build our request payload. We'll do the request, then save its output into a dataframe.
After that, we extract and preprocess Kent County Influenza-Like Illness incidence data. We use sklearn's StandardScaler to center each variable around their respective means, then combine all variables into a single dataframe.
To explore and compare our variables, we want to create a line graph with each variable as a unique series. But first, we must transform the data into long-form by unpivoting the dataframe. Fortunately, pandas' melt() method makes pivoting and unpivoting data super easy.
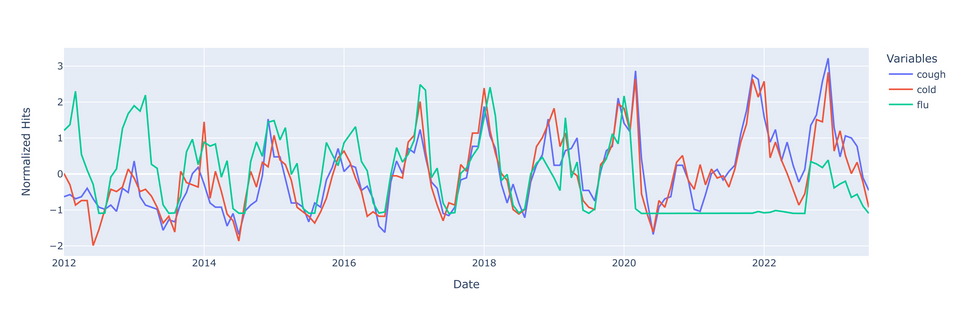
Last but not least, let's plot our data
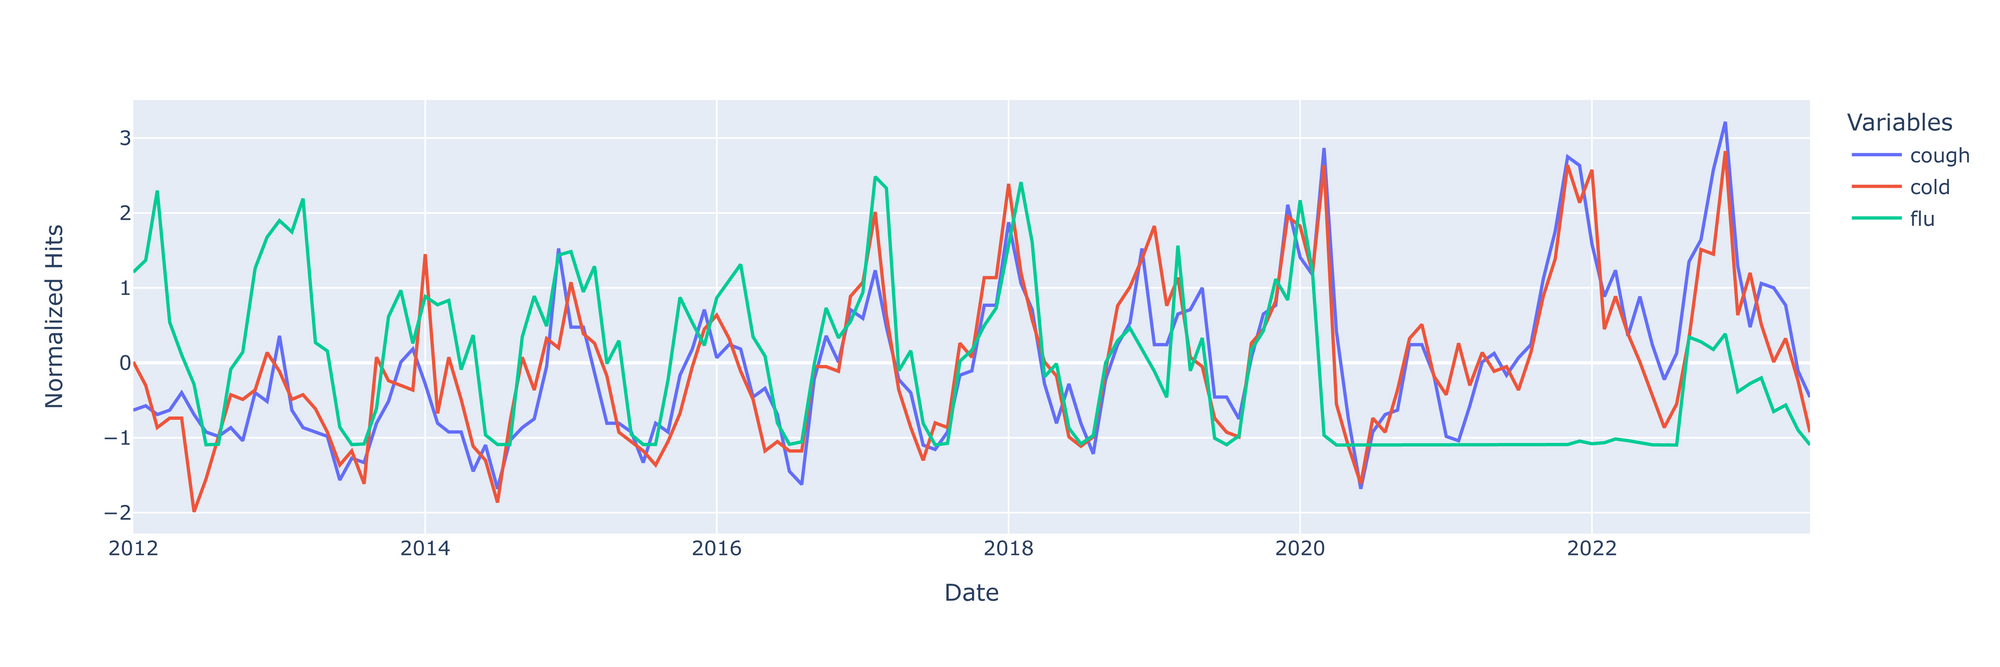
There's a few things to note before we try to make any inferences from this graph.
- ILI went under-reported during the beginning stages of COVID - this is seen with the flatline on the right. These will skew the ILI incidence data downward; data from that period should really be censured entirely.
- Additionally, flu spikes in 2013 and 2018, likely due to H1N1 epidemics. I don't suspect that these spikes will have a detrimental skewing effect on flu data.
- Lastly, the rise and fall of google searches for 'cough' and/or 'cold' seems be be growing over time. This might be a result of increasing internet use over time.
With these points in mind, it doesn't seem that the google searches are preceding spikes in flu incidence. It might be that the searches truly have no predictive value for flu, or perhaps the rate of change in google searches would be better predictors of impending flu spikes. More analysis is required.