Data Modernization in Local Public Health
Automating Communicable Disease Surveillance Data Management to Inform Timelier Public Health Response in Michigan
Background
Public Health Informatics (PHI) is the “systematic application of information and computer science and technology to public health practice, research, and learning” (Magnuson & Dixon, 2020). PHI is a vital component within CDC’s Data Modernization Initiative (DMI) (Opening up Health Data for All | 2022 DMI Snapshot | CDC, 2022). CDC defines data modernization as an “effort to modernize core data and surveillance infrastructure across the federal and state public health landscape.” Data modernization creates response-ready public health systems by utilizing technology to connect the right people, processes, and policies to real-time public health data. CDC is using DMI to strengthen public health data reporting and analytics, optimize disease surveillance, support the public health workforce, and deliver trustworthy guidance to the community (CDC, 2022).
The momentum behind data modernization has already led to advancements within governmental public health – one example is the MDSS in Michigan. The Michigan Disease Surveillance System (MDSS) is a web-based communicable disease reporting system to facilitate coordination among Michigan health agencies. MDSS manages the transfer, maintenance, and analysis of communicable disease surveillance data, promotes stakeholder participation, and addresses other needs related to disease surveillance (Michigan Disease Surveillance System Background, n.d.). Local health departments (LHDs) within the state benefit from the unified, state-wide surveillance system. While MDSS has continued to adapt and evolve to serve the needs of the state over the last 18 years, the system still contains gaps within the primary data collection to analysis pipeline which limit LHD capacity to meet community surveillance needs.
Local health departments in Michigan face challenges in surveillance data analysis, interpretation, and dissemination. First, the data querying process of MDSS requires robust data management processes expertise. Next, data must be cleaned and preprocessed before it is formatted for effective dissemination. Finally, data must be reported, integrated, and interpreted to guide public health response. In local health departments with limited resources, these gaps in surveillance data management capacity are significant barriers to timely public health intervention, especially during emergent communicable disease issues in the community.
This public health Applied Practice Experience report addresses these challenges through demonstration of an automated data management and informatics pipeline, which has improved communicable disease surveillance data sharing in a local public health department in Michigan.
Methods
The automated pipeline included multiple steps: MDSS data query curation via user-interface, data preprocessing and formatting, dataset integration, and summary data reporting. Pipeline query curation and data management were implemented with a custom-developed python software tool, and data reporting was done in Power BI.
Query Curation
Dissemination of communicable diseases varies based on case status and investigation status. Diseases were grouped together based on these case status and investigation status “settings,” with one MDSS 5-year dataset query per disease group. A graphical user interface was included to facilitate user-specified changes to disease group settings, as well as to guide the user through the process of each MDSS query step-by-step.
Dataset Integration and Processing
Each MDSS output dataset included data for every reportable disease. First, output metadata were checked against their associated disease group settings to catch possible data query errors. Aggregated disease data rows and metadata were then trimmed, and discordant disease names were normalized. Next, relevant disease data were selected from each output dataset and aggregated into one master dataset.
Cumulative disease year-to-dates (YTDs), month averages, and YTD averages were calculated and added to the dataset. The dataset structure was then reformatted into the “long-format” and piped into Power BI for report development.
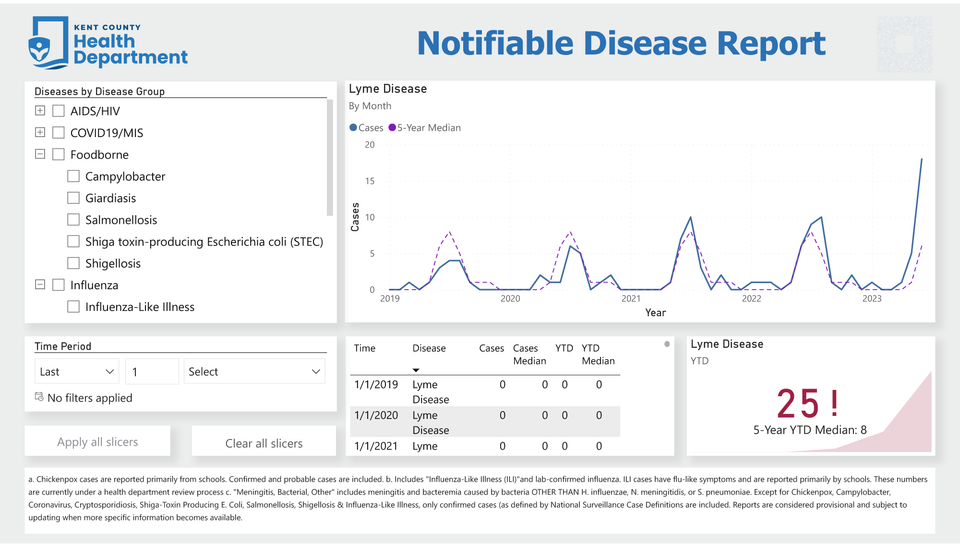
Data Visualization and Reporting
Data were piped into an intuitive, interactive Power BI data report. The viewer may specify their specific diseases and timeframes of interest, and monthly disease case counts were visualized in a line graph alongside each month’s 5-year average case count. In another card, disease YTDs were displayed against their 5-year YTD averages. Color was utilized to promote ease of understanding; disease YTDs were displayed in red when higher than their 5-year average, and in green when lower.
Results
The visual summary in this project’s Power BI report identified significant 5-year increases in invasive Group A Streptococcal Disease, Gonorrhea, and Lyme Disease. Such changes in disease patterns were not previously identifiable without significant data collection, management, and visualization across monthly case count pdf reports.
Additionally, manual data management requirements of surveillance data dissemination were substantially lowered. The previous process required 8-12 hours per month of MDSS querying, copy-pasting data, and manual data entry, formatting, and calculation. The pipeline lowered this time-cost down to ~20 minutes per month.
Discussion
The integration of data modernization into routine communicable disease surveillance in local public health is a complex, multi-step, and multi-disciplinary process. Despite substantial progress in communicable surveillance data sharing and interoperability through CDC’s Data Modernization Initiative, the timeliness of data dissemination remains a challenge at the local level, due in part to limited resources. This project’s pipeline is a small step towards increasing LHD access to improved public health service delivery through the use of the data resources available through a wider, state-level surveillance data centralization platform.
Significant software engineering resources were spent on the development of the automated pipeline in this project. To improve access to data automation for local public health, this project’s pipeline automation software was made open-sources for other teams to use and learn from. While the software is still in alpha as of September 2023, it will effectively function as-is for other county level health departments in the state of Michigan.
Conclusions
An automated data management pipeline was implemented in this Applied Practice Experience to examine the impact of combining public health informatics expertise with applied communicable disease surveillance practice in a local public health department. Surveillance data dissemination was enhanced, and novel disease incidence insights were generated, contributing to the timeliness of public health response and intervention, and saving the health department 100 hours of data management time per year. These savings act as evidence in support of investment of informatics at the local public health level.
References
Magnuson, J., & Dixon, B. E. (2020). Public Health informatics and information systems. Springer Nature.
Michigan Disease surveillance System background. (n.d.). https://www.michigan.gov/mdhhs/keep-mi-healthy/communicablediseases/mdss/michigan-disease-surveillance-system-background
Opening Up Health Data for All | 2022 DMI Snapshot | CDC. (2022). https://www.cdc.gov/surveillance/data-modernization/snapshot/2022-snapshot/stories/opening-up-health-data.html